
Are you feeling that glorious victories that should be yours are unduly stolen by some lucky friends on a regular basis?
Do you feel the cards are always against you?
In Catan, as in many games, luck can have a dramatic effect on the final outcome. But as much as some would like to think, people are not born lucky, or unlucky.
Of course, chance can unjustly favor someone on some occasions, but making the right choices based on good probability evaluations can go a long way in making you the next “lucky winner”!
In board games, chance favors only the prepared mind.
– Louis Pasteur (if he had played board games)
Welcome to the second part of this analysis of all possible Catan Victories!
- Previously, we examined all the possible ways to win a game of Catan – and their minimum cost.
- Today, we will calculate: The expected cost of every possible way to win – based on cards drawing probability
- Next time, we will come back with the fastest ways to win at Catan – looking at settlements and resources income.
What to expect in this post
In the first part, we established a baseline, the minimum cost in resources, to compare all the possible Catan victories against each other.
But this was ignoring the randomness involved in a game of Catan. If part of your strategy is based on buying development cards, chance will influence how your potential victory will end up costing you.
To get a better estimate of real life victory cost, we need to analyze the probabilities involved in drawing cards, and how it affect the expected cost of each victory.
There is no guarantee that you’ll pay the expected cost, but it will at least allow you to calculate precisely what luck should look like when you are drawing cards!
Moreover, since cards in board games can have all sort of side effects, we’ll see how we can take those into account for the expected cost evaluation!
I even included a Catan drawing card simulator to help you understand how probabilities evolve during the game!
In the end, we will have to merge some victories together, and we will get the following per victory cost breakdown:

But you will have to read on to understand correctly the content of this graph!
Note: If you did not read the first Part of this analysis, I encourage you to do so. It is not necessary, but it will give you some context for this post, especially if you are not that familiar with Catan!
Let’s go back to the final question raised in part one.
Is the cheapest victory the best strategy?
If you remember, the cheapest victory in term of minimal cost was achieved with the following components:
- Two settlements (given at the start)
- Having the longest road (with 5 road segment)
- Having the Biggest Army special card, obtained by playing 3 knight cards
- Having 4 Victory points development cards
And it turns out that one can win while having received only 23 resource cards!
The astute reader will see a damning flaw in the cheapest victory approach:
It involves drawing 7 specific development cards: 3 knights cards for the biggest army and 4 of the 5 victory point cards from a shuffled deck of 25 cards… Hoping to only receive the cards you wish for!
It is literally wishful thinking!!!
So to evaluate the real-life cost of a victory, we have to consider the Expected Cost of buying cards needed for the victory.
In others words:
Given the probability of drawing the specific cards needed from the deck, how many cards will I have to draw, on average, to receive the ones I wish for?
The Catan deck of cards
In Catan, the deck of development cards contains 25 cards.
- 14 Knight cards
- 5 Victory Points cards
- 2 Years of Plenty cards (Gives 2 resources cards of your choice)
- 2 Monopoly cards (Allows to steal all the resources card of single type from all the players)
- 2 Road builder card (Allows to build 2 road segment, for free)
If you simply want to know what is the probability of picking – let’s say – One knight card from the deck, it’s very simple:
There are 14 knight cards, in an untouched deck of 25 cards.
The probability is 14/25 or 56%
However, if you want to know how many cards you’ll need to draw, on average, to get 3 knights and 1 victory point card… it gets a bit trickier.
If you want to know how, simply click on show me the math, and I’ll tell you all the nitty gritty details about it.
[accordion tag=h3 clicktoclose=”true”]
[accordion-item title=”+ Show me the Math” id=math-card-picking-catan-probabilities state=closed]
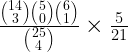
If you simply want to know what is the probability of picking three knights with your first three cards, simple combinatorial will give you a direct answer.
Using the n-choose-k 
You calculate how many different ways there is to draw 3 of the 14 knights cards from the deck.

And you divide by how many different ways you can draw any 3 cards from the deck.

This gives us: 364/2300 = 0.1583
or if you prefer: 15.83% of chance of picking 3 knights cards on our first 3 cards!
This may look a bit complicated, but if you look at the numbers involved, this simplify to simply multiplying the ratio of how many knight cards in the deck to how many cards there is in the deck, for each three consecutive draw:
- At first, there are 14 knights in a 25 cards deck
- If you draw a knight, there is now 13 knights in a 24 cards deck
- If you draw a knight, there is now 12 knights in a 23 cards deck

The problem is however slightly more complicated since you have to take into account all the type of cards in the deck, even if you do not intend to draw them.
We can do it for our previous calculation by taking into calculation all the combinations for each type of cards in the deck, which will gives us:
- For the knights cards:
- For the Victory points cards
- For the Year of Plenty cards:
- For the Road Building cards:
- For the Monopoly cards:


This gives us the following:

It does not change our result here because, in n-choose-k, there is only one way to select zero cards in a group, so all those n-choose-0 end up being 1, and have no effect on the final result.
Actually, since we do not need to differentiate between cards of other type than knights, we can simplify to considering two types of cards: the 14 knights, and 11 others:

Now we are equipped to calculate more complex combinations!
If we want to know the probability of picking 3 knights and 1 victory point card on your first 4 cards, we can use the same approach:
Here we multiply the way of picking 3 knights cards with the ways of picking 1 of the five victory point cards, and the way to pick 0 of each of the other card types.
Which gives us the following:

Which gives us: 14.39 %
The optimistic case, which is the probability of only drawing the needed card is pretty easy to calculate…
However, we would like to know the expected case: On average, how many cards would you have to draw to get the cards you need for your victory.
For the expected case, you then need to calculate the probability for all possibles number of draws, and do a weighted sum of the probabilities:
If we define:
P1 = Probability to get all the cards you want after 1 draw
P2 = Probability to get all the cards you want after 2 draws
…
Pn = Probability to get all the cards you want after N draws.
You can calculate how much cards you will need with the following:
P1 X (1 card) + P2 X (2 cards) + P3 X (3 cards) … + Pn X (n cards) = Expected drawing cost
For example:
In the imaginary case where you had 25% of chance to pick the desired card on the first draw, 50% of chance on the second draw and 25% of chance on the third draw, and 0% chance after we would get:
(0.25 * 1 card) + (0.50 * 2 cards) + (0.25 * 3 cards) = (0.25+ 1 + 0.75)
= 2.0 cards (on average)!
The devil is in the details
However, you have to be careful how you calculate those probabilities… if for example, you want to know the % of chance that you’ll pick the third knight on the fourth draw, you cannot use the following:

Since it will also include all the times where you pick the 3 knights on your first 3 cards, in which cases, you would not need to draw a fourth card… And if you want the probabilities for a mix of different cards, it gets complicated pretty fast…
A nicer approach you can take is to calculate the chance of drawing all but one of the cards you want on your first N-1 draw, and then multiply it by the chance of drawing the correct card on your Nth draw.
- Use n-choose-k to calculate the chance of drawing all but one of your needed cards.
- For the chance to pick the correct card on your last draw, it’s a simple ratio of how many cards of the wanted type there are left in the deck, divided by the number of cards in the deck.
For example, to know the chance of picking your third knight on the 4th draw, you calculate the chances to pick 2 knights and 1 “other” card on your first 3 draws.

And for your fourth draw (the Nth draw here), you know there are 12 knight cards left in a deck of now 22 cards.
So:

If you need a mix of different kinds of cards, you’ll have to add the probabilities of the different scenarios. In fact, you’ll need as many scenarios as the number of different kind of cards you want at the end. Each case being drawing the last needed card of its kind as the last draw.
For having 3 knights and 1 victory points, on the fifth draw:
(as a reminder: there is 14 knights, 5 victory points, and 6 “others” cards in the deck)
First, we calculate the probability of having picked (2 knight cards, 1 victory point card and one “other” card) for our first 4 cards, multiplied by the probability of picking the missing 3rd knight on the fifth card. For the fifth draw in this scenario, there is 12 knight left in a deck of 21 cards.

Second, you calculate the probability of having picked (3 knights, no victory point card and one “other”) for our first 4 cards, multiplied by the probability of picking the missing victory point card on the fifth card. In this scenario, there is 5 victory point card left in a deck of 21 cards.
In Full:

Which gives us: 12.33% + 4.11% = 16.44%
The brute force approach
Finally, one way to get the expected numbers of cards you will need to draw to get a list of specific cards is to use brute force: Simply calculating by hand all the probabilities, each step of the way.
- You start with a deck full of cards, then you calculate the probability of drawing each type of card on your first draw. There are 5 possible cases.
- And you do the same for the second draw: For each previous case, you calculate the probabilities of drawing each type of cards again. There is now 25 cases.
- And you repeat for each subsequent draw until there are no cards left in the deck.
You will end up with a probability tree, that you can use to calculate the exact probability for different sets of desired cards.
I would not do this by hand for a deck of 25 cards! It is far easier and less prone to error to let the computer do the job!
Coding this is not too complicated, and it offers an interesting advantage. In a game like Catan, you can take into account the special cards, like the Road builders, Years of Plenty and Monopoly that can save you, or give you some resource cards.
You do not need those cards to achieve victory, but they can reduce the total expected cost of buying all the cards you need.
I there is any interest in this, I’ll add the code to show you how it’s done!
[/accordion-item]
[/accordion]
The expected Cost of a victory
Once you know how many cards you’ll have to draw on average to get the desired cards, you can use this information to calculate the Expected cost of a victory!
We already calculated the minimum cost for the roads, settlements, and cities in the first part of the analysis.
We only need to replace the minimum cost of drawing development cards with the new expected cost of drawing development cards for each victory, and that’s it!
This will give us a new list of victory cost, based on their expected cost. A much more realistic way of evaluating the in-game cost of a victory!
The expected cost of drawing development cards
In Catan, there is, however, more to drawing cards than simply picking up victory points. There are differents kinds of cards that can be helpful in various ways.
Thus, to get a correct estimate of cards cost, you need to take into account their beneficial side effects.
For example:
In the case of a victory where you only need to draw 3 knights cards to get the biggest army, you’ll end up having to draw, on average, 5.2 cards.
It means that, aside from the 3 desired knight cards, you will typically end up with a few additional cards that will have beneficial side effects. We can attribute a value for those side effect in term of resources cards, and use it to calculate the real expected cost of buying the cards you need.
The real expected cost is lower than the total cost of the cards!
Beneficial side effects of cards
For the development cards not bringing directly the much-desired victory points, here are the side-effects I considered:
- Road Building card, if you need the road for your victory, reduces by 4 resources the expected cost of a hand.
- Year of Plenty reduces the expected cost of hand by 2 resources.
- Monopoly will vary in its return, but I decided to assume that it brings you 4 resources cards.
- Knight will reduce the expected cost by one resource card.
All this drives down the cost of scoring victory points through development cards quite a bit.
Buying them all!
To push the idea to its limits, I decided to calculate the cost of buying all the cards!
At face value, buying the whole deck of 25 cards, at a cost of 3 resources each, should cost you 25 x 3 = 75 cards.
However, once we take all the returns given by the cards into account, buying the whole decks suddenly cost a lot less:
- Buying cost: 3x 25 cards: +75 cards
- Knights stolen cards: 1 x 14 cards = -14 resources cards
- Road Network: 4 x 2 cards = -8 resources cards*
- Year of Plenty: 2 x 2 cards = -4 resources cards
- Monopoly: 4 x 2 cards = -8 resources cards
(25 * 3) – 14 – 8 – 4 – 8 = 41 resources cards
*The discount for Road segments can only be applied if you need the roads for your victory!
What about the value of unexpected victory point cards?
Here I ran into a conundrum: What if you pick more victory points cards than you intended?
In Catan, victory is declared as soon as you reach 10 points, so an extra victory point means that you’ll get one less victory point from another source. It changes the possible combinations of victory elements you can achieve.
So what do we do when evaluating the probabilities of drawing cards for a particular victory?
Ignore the possibility to draw victory point cards?
Or ignore the impact of drawing those cards when evaluating victories that are not supposed to involve them?
The Real Expected Cost of Victory
This is obviously only a theoretical conundrum. It exists because we are trying to evaluate the cost of each possible victory separately.
But in practice, a victory point is a victory point, is a victory point.
One way to get a real expected cost for each possible victory is to proceed with calculating the probabilities of drawing cards. But to stop drawing cards as soon as we reach the desired number of victory points, no matter what they are.
This somehow implies merging some victories together, since having the biggest army or drawing 2 victory point cards are now considered equivalent for a victory. There is no need to represent them as separate.
This is a necessary evil: you can still track the achieved victories as being different if you want to build some list of all the victory you achieved, but their expected cost will be the same.
Moreover, you do not have a choice of which one you will end up with, only the cards you draw will determine that.
This gives us a new way of considering drawing development cards. And modify quite a bit the expected cost of drawing them.
- To score 1 victory point you are now expected to draw 2.95 development cards.
- This would normally cost you 8.85 resources cards.
- With the beneficial side effects, the real price will only be 5.85 resources card!
- Or only 5.01 resource cards if you can use one Road Builder development card in your strategy!
Actually, the expected cost per Victory point is even lower for 2 and 3 victory points (and larger after that). This is due to the large amount of knights in the deck and the high likelihood of drawing 3 knights early in the game!
Here is a small table showing you what to expect:
| Nmb of Vp | Expected card Draw | Raw Expected Cost (resources cards) | With side effects (resources cards) | Cost per VP (resources cards) |
|---|---|---|---|---|
| 1 | 2.95 | 8.85 | 5.01 | 5.01 |
| 2 | 4.43 | 13.29 | 7.52 | 3.76 |
| 3 | 6.39 | 19.17 | 10.99 | 3.66 |
| 4 | 9.40 | 28.20 | 16.46 | 4.11 |
| 5 | 13.19 | 39.57 | 23.46 | 4.69 |
| 6 | 17.37 | 52.11 | 31.29 | 5.21 |
| 7 | 21.67 | 65.01 | 39.53 | 5.65 |
Note: In this table, I assumed for the expected cost that you can make use of maximum one road building card. This will vary for different victory combinations.
No merge is perfect
Unfortunately, even with the merge, cards drawing makes defining victory condition a bit tricky… You can pick up more victory points than intended!
This is due to the fact that the biggest army scores two points at once. So if you are only one victory point short of the desired amount, drawing a third knight card instead of a victory point card may give you one more victory point than expected.
At first, I decided to ignore this, but a nagging feeling kept me thinking about it. I decided to check how often this would happen, by tracking the chance of getting one victory point more than expected, and I was surprised to find the following occurrence:
| Desired Victory points | Chance of obtaining 1 more VP |
|---|---|
| 1 | 37.56% |
| 2 | 35.22% |
| 3 | 18.78% |
| 4 | 6.71% |
| 5 | 1.55% |
| 6 | 0.18% |
| 7 | 0.00% |
I could not ignore an almost 38% or 35% chance of getting an extra victory point. So I decided that from a real game point of view, I should discount the expected cost where the extra point can happen with an appropriate cost in resources.
I just had to figure out how many resource cards would this extra victory point be worth. It is a bit complex at this point because it depends on when you get the extra point, and how you adapt your strategy to it.
For the sake of clarity, I decided that:
- Those extra victory point would not affect our merged victory list, even if the actual victories could be different.
- They would have a beneficial side effect of 4 resources cards for the extra point when it occurs in the probability tree.
In the end, it reduces some victories cost by 1 or 2 resources cards, depending on the victory combination, and I think it is the best way to account for those extra points.
(You can check the drop-down if you want more details on this).
[accordion tag=h3 clicktoclose=”true”]
[accordion-item title=”+Rambling about the cost saving of the additional victory point” id=math-card-picking-catan-probabilities state=closed]
I decided to do a note on this victory point issue because… well it’s complicated.
Obtaining an additional victory point change the victory condition, and will either let a player decide which victory point it will replace or ends up changing a victory from a 10 point victory to an 11 point victory. In this last case, it will not save you anything, since the additional victory point is not needed anyway to win.
So you have to consider different options: For a victory of 10 points, it depends on when it is obtained and can replace any victory points.
For an 11 victory, if the victory does not involve the longest road, it was necessary to get the biggest army anyway.
For 12 victory points, it can change the composition of the victory, or avoid the necessity of obtaining the longest road.
But in all those cases, the impact will be left to the particular game being played.
If you look at the resources cost of victory points in the game, you end up with costs being at least 4 or 5 for settlements and city upgrades, ignoring the road cost associated.
For the longest road, well, it depends on the victory. I do not have a good answer, and since we are trying to attribute a “cost reduction” on a victory that will end up being different than the one we are after.
Well…. I decided to attribute a cost of 4 resources to this additional victory point. Because it is of value to the player almost all of the time, and it impacts the cost of the victory achieved, even if it makes the prediction of which victory that would be muddier.
In this post, I wanted to bring some real gameplay value into the expected cost analysis, and the real world has a way of not neatly fitting into boxes! So it is not a fully scientific evaluation of its value, but I feel it is an honest evaluation for the extra point. Let me know what you think!
There is maybe a better way to proceed, maybe we could develop some kind of victory tree? Something I will sleep on, and maybe some material for a future post! If you have an opinion on this, let me know!
End of rambling.
[/accordion-item]
[/accordion]
Statistics are alive!
One last thing before you rush to establish your strategy based on the expected cost numbers, it is good to remember that those are upfront estimates. They represent the average cost you can expect to pay before the game starts! However, each time you draw a card, the probabilities and expected cost will change depending on what card you just draw!
We can see this in the lowest cost per victory point estimate. While you are drawing cards hoping for the largest army, you have good chances of drawing a victory point card along the way, and pretty much any cards can be useful to you. All the possibilities of drawing early victory point cards lower the final expected costs.
If however, you draw your three knights right away, you still have 44% of chance of drawing another knight, but it will be almost useless to you at this point. The more victory points you aim for, the more all the extra knights that you might get after the initial three weight on the expected cost for those points.
This is not to say that you cannot use the list to establish a good strategy. But you have to adapt your strategy along the way!
In short, if you have other options of victory points, drawing cards until you get the biggest army and stopping buying card after that is not a bad strategy at all!
See for yourself
In order for you to see this by yourself, I created a small simulator for the expected cost of drawing cards. You can see by yourself how the expected cost change as you draw cards, and this can give you an idea on how you should adapt your strategy depending on the cards you draw.
Here is how to use it:
- Enter the desired number of each card type OR the desired number of victory point
- Evaluate the expected cost
- Draw random, or specific cards for you or an opponent
- And see the expected cost for your hands evolve!
Some Notes:
- All the costs are expressed in development cards equivalent.
- If you want to know how many resources cards it represent, multiply by 3!
- The raw cost shows the number of development cards you are expected to buy.
- The discounted cost is with all beneficial side-effect taken into account.
- I do not discount for the possible Extra VP here, but it will tell you if you get one.
 X
X 0.47 %
 X
X 0.47 %
 X
X 0.47 %
 X
X 0.47 %
 X
X 0.47 %
Knights:
Victory Points:
Years of Plenty:
Road Building:
Monopoly:
Knights:
Victory Points:
Years of Plenty:
Road Building:
Monopoly:
(in development cards)
Expected For Desired:
Final Expected Cost:
(in development cards)
Expected For Desired:
Final Expected Cost:
Note: For this calculator, I assumed you benefit from all the Road Building cards you get. I’ll continue improving it but let me know if you find it useful, or if you would like some improvements!
This calculator is now also available in the “Gaming tools” section of this website!
Ok, I want to know the results of all this!
The cheapest expected victory
Well, the cheapest victory list is suddenly quite different. The previous cheapest victory is now in 24th position!
The first 23 cheapest victories all involve getting the Longest Road. But you still need to go at the 14th victory before finding one that does not involve drawing development cards!
Drawing development cards is now costlier, but it is still part of a winning strategy!
The new cheapest victory has an expected cost of 30.24 resources cards, and involve:
- The longest road
- 1 settlement
- 2 cities
- 3 victory points coming from development cards (Here either The biggest Army + 1 VP card OR 3 VP cards)
The costlier expected Victory
The new costlier victory has an expected cost of 54.34 resources cards, and involve:
- 1 city
- 2 settlements
- 7 victory points cards, (The biggest Army + 5 victory points being the only option)
Suddenly, getting all the victory point cards is the less effective solution… And for good reason! The probability of getting quickly 5 victory point cards is very low! On average, you’ll have to buy almost all the cards to get them… Which can be impossible if other players are also buying cards… As soon as someone else draws one of the victory point cards, you are done!
As a side note, the costlier victory is a weird victory since it involves getting all the victory point cards… without achieving the biggest army. Something that is statistically unlikely!
But that being said, I would not personally be too optimistic about any victory that demands drawing on average more than half the deck of cards!
The real gameplay expected cost of victories
[accordion tag=h3 clicktoclose=”true”]
[accordion-item title=”+ Victory expected cost for the Merged 98 -ways of winning at Catan” id=expected-cost-of-winnings-at-catan state=closed]
- Here is the expected cost for all victories, based on the expected cost for drawing cards.
- We do not differentiate between types of victory points from the development cards
- This merge certain victory together, so we only have 98 victory conditions left.
- (*) indicated victories involving 12 victory points, as explained in the first part of the analysis
- You can sort the results by clicking on column titles.
| Longest Road | Cities | Settlements | Development cards VPs | Victory Cost | Expected Nmb of Cards | Expected Cost |
|---|---|---|---|---|---|---|
| yes | 2 | 5 | 0 | 42 | 0.00 | 44.00 |
| yes | 2 | 5 | 1 | 45 * | 2.45 | 47.43 |
| no | 2 | 0 | 6 | 28 | 17.37 | 44.72 |
| no | 2 | 4 | 2 | 38 | 3.96 | 39.97 |
| no | 2 | 0 | 7 | 31 | 21.67 | 53.34 |
| yes | 2 | 0 | 5 | 30 | 13.17 | 39.40 |
| yes | 2 | 0 | 4 | 27 | 9.31 | 32.19 |
| no | 2 | 5 | 1 | 43 | 2.45 | 45.43 |
| no | 2 | 5 | 2 | 46 | 3.96 | 47.97 |
| no | 1 | 2 | 7 | 32 | 21.67 | 54.34 |
| no | 1 | 2 | 6 | 29 | 17.37 | 45.72 |
| no | 1 | 1 | 7 | 26 | 21.67 | 48.34 |
| yes | 1 | 5 | 3 | 40 * | 6.14 | 42.94 |
| yes | 1 | 5 | 2 | 37 | 3.96 | 38.97 |
| no | 3 | 0 | 5 | 36 | 13.17 | 47.30 |
| no | 3 | 0 | 4 | 33 | 9.31 | 39.46 |
| no | 2 | 3 | 3 | 36 | 6.14 | 38.24 |
| no | 0 | 4 | 6 | 29 | 17.37 | 43.29 |
| no | 0 | 4 | 7 | 32 | 21.67 | 51.53 |
| no | 0 | 3 | 7 | 27 | 21.67 | 49.34 |
| no | 1 | 5 | 3 | 36 | 6.14 | 38.94 |
| no | 1 | 5 | 4 | 39 | 9.31 | 44.57 |
| no | 2 | 2 | 4 | 33 | 9.31 | 38.19 |
| no | 4 | 1 | 2 | 43 | 3.96 | 44.12 |
| no | 1 | 3 | 6 | 34 | 17.37 | 48.29 |
| no | 1 | 3 | 5 | 31 | 13.17 | 40.40 |
| no | 3 | 1 | 3 | 35 | 6.14 | 37.24 |
| no | 3 | 1 | 4 | 38 | 9.31 | 43.19 |
| yes | 4 | 2 | 0 | 46 * | 0.00 | 48.00 |
| no | 3 | 2 | 2 | 38 | 3.96 | 39.12 |
| no | 3 | 2 | 3 | 41 | 6.14 | 43.24 |
| no | 2 | 1 | 5 | 31 | 13.17 | 42.30 |
| no | 1 | 4 | 5 | 37 | 13.17 | 46.40 |
| no | 1 | 4 | 4 | 34 | 9.31 | 39.19 |
| no | 0 | 5 | 5 | 32 | 13.17 | 41.40 |
| yes | 4 | 0 | 0 | 34 | 0.00 | 36.00 |
| yes | 2 | 2 | 3 | 33 | 6.14 | 35.94 |
| yes | 2 | 2 | 2 | 30 | 3.96 | 31.97 |
| no | 0 | 5 | 6 | 35 | 17.37 | 49.29 |
| yes | 4 | 0 | 1 | 37 | 2.45 | 39.43 |
| yes | 2 | 2 | 4 | 36 * | 9.31 | 41.57 |
| no | 3 | 4 | 0 | 45 | 0.00 | 47.00 |
| yes | 3 | 4 | 0 | 47 * | 0.00 | 49.00 |
| yes | 0 | 5 | 5 | 35 * | 13.17 | 44.24 |
| yes | 0 | 5 | 4 | 32 | 9.31 | 37.57 |
| yes | 0 | 5 | 3 | 29 | 6.14 | 31.94 |
| no | 3 | 3 | 1 | 40 | 2.45 | 42.43 |
| yes | 2 | 4 | 2 | 42 * | 3.96 | 43.97 |
| yes | 1 | 3 | 3 | 28 | 6.14 | 30.94 |
| yes | 2 | 3 | 1 | 33 | 2.45 | 35.43 |
| yes | 1 | 3 | 5 | 34 * | 13.17 | 43.24 |
| yes | 2 | 3 | 3 | 39 * | 6.14 | 41.94 |
| yes | 1 | 3 | 4 | 31 | 9.31 | 36.57 |
| yes | 2 | 3 | 2 | 36 | 3.96 | 37.97 |
| yes | 3 | 2 | 2 | 41 * | 3.96 | 42.97 |
| yes | 3 | 2 | 1 | 38 | 2.45 | 40.43 |
| yes | 3 | 2 | 0 | 35 | 0.00 | 37.00 |
| yes | 3 | 1 | 2 | 35 | 3.96 | 36.97 |
| yes | 3 | 1 | 3 | 38 * | 6.14 | 40.94 |
| yes | 2 | 1 | 3 | 28 | 6.14 | 30.24 |
| yes | 2 | 1 | 4 | 31 | 9.31 | 36.19 |
| yes | 2 | 1 | 5 | 34 * | 13.17 | 43.40 |
| yes | 3 | 0 | 2 | 30 | 3.96 | 31.12 |
| yes | 3 | 0 | 3 | 33 | 6.14 | 35.24 |
| yes | 0 | 4 | 5 | 29 | 13.17 | 38.24 |
| yes | 0 | 4 | 4 | 26 | 9.31 | 31.57 |
| yes | 3 | 1 | 1 | 32 | 2.45 | 34.43 |
| yes | 1 | 1 | 6 | 28 | 17.37 | 42.29 |
| yes | 1 | 1 | 7 | 31 * | 21.67 | 50.53 |
| yes | 1 | 1 | 5 | 25 | 13.17 | 34.40 |
| yes | 1 | 2 | 4 | 26 | 9.31 | 31.19 |
| yes | 2 | 4 | 0 | 36 | 0.00 | 38.00 |
| yes | 1 | 4 | 3 | 34 | 6.14 | 36.94 |
| yes | 1 | 4 | 4 | 37 * | 9.31 | 42.57 |
| yes | 1 | 4 | 2 | 31 | 3.96 | 32.97 |
| yes | 1 | 2 | 5 | 29 | 13.17 | 38.40 |
| yes | 2 | 4 | 1 | 39 | 2.45 | 41.43 |
| yes | 1 | 2 | 6 | 32 * | 17.37 | 46.29 |
| yes | 0 | 3 | 5 | 24 | 13.17 | 33.40 |
| yes | 0 | 3 | 6 | 27 | 17.37 | 41.29 |
| yes | 0 | 3 | 7 | 30 * | 21.67 | 49.53 |
| no | 4 | 1 | 1 | 40 | 2.45 | 41.51 |
| yes | 0 | 4 | 6 | 32 * | 17.37 | 45.38 |
| no | 4 | 0 | 2 | 37 | 3.96 | 38.12 |
| yes | 1 | 5 | 1 | 34 | 2.45 | 36.43 |
| yes | 0 | 2 | 7 | 26 | 21.67 | 45.53 |
| yes | 0 | 2 | 6 | 23 | 17.37 | 37.29 |
| no | 4 | 2 | 0 | 42 | 0.00 | 44.00 |
| yes | 4 | 1 | 0 | 40 | 0.00 | 42.00 |
| yes | 4 | 1 | 1 | 43 * | 2.45 | 45.43 |
| no | 3 | 3 | 2 | 43 | 3.96 | 44.97 |
| yes | 3 | 3 | 0 | 41 | 0.00 | 43.00 |
| no | 4 | 0 | 3 | 40 | 6.14 | 42.24 |
| yes | 3 | 3 | 1 | 44 * | 2.45 | 46.43 |
| no | 2 | 1 | 6 | 34 | 17.37 | 50.72 |
| no | 2 | 2 | 5 | 36 | 13.17 | 45.40 |
| no | 2 | 4 | 3 | 41 | 6.14 | 43.94 |
| no | 2 | 3 | 4 | 39 | 9.31 | 44.19 |
[/accordion-item]
[/accordion]
Beware of the high expected costs
All that being said, there is one aspect one may overlook when using the expected value: It gives you the average value. You’ll get there, or faster, around 50% of the time.
But like any average, one have to consider the spread of the probabilities: The risk of going way overboard is not shown by the average value!
To illustrate my point, check the following graph. It represents 3 ways of evaluating the probability of getting 3 victory points by drawing cards.
- The first only by getting the biggest army and 1 VP card (in blue)
- The second by accepting any of those two options, and stopping if we get 3 victory points or more (in red).
- The third by getting 3 victory point cards (in yellow)
The height of the bars represents the percentage of times you’ll have to draw a given number of cards to achieve your goal. (For example, the red bar shows that you’ll have to draw 4 cards about 15% of the time, and 5 cards about 25% of the time)
This shows you that the probability while being distributed around a central value, can spread very differently on each side.
Sometimes, the chance of having to draw a lot more or a lot less than the average is not negligible… So it starts becoming more gambling than planning!

Resources cards, availability and exchange costs
One aspect I did not evaluate here is the cost of victory points in real resources cards.
When you play, you may receive other resources cards that you would ideally like. To obtain the correct ones, you may have to trade with other players, or even with the bank (4 resources to 1, ouch!).
Maybe we should include a multiplicative factor in the cost: obtaining any wanted resource cards may have a real cost of, let’s say 1.5 resource cards, depending on where your settlements are built, which resources you need, which harbors you have access to, and what is the generosity of your adversaries in trades.
This is not something to dismiss. If on average you pay 1.5 resources cards for each resource card you need, instead of the cheapest victory at 30.99 and costlier at 54.34, the cost would jump to 46.49 for the cheapest and 81.51 for the costlier. The difference in the number of cards needed goes from 23.35 to 35.02 resources cards.
It makes the cheaper victories much more attractive and this has to be kept in mind when evaluating victory costs!
Thankfully, it does not change the cost order of the victories, so we can at least take that for granted… for the moment!
Revisiting the breakdown graph
As we can see, the longest road is part of much of the lower cost victories. Aiming for too many victory points from development cards is prohibitive most of the time, but amusingly is not that expensive if you forget about cities and additional settlements and only aim at buying most of the developments cards!
This certainly rebalances the situation toward more central victory conditions, aiming to spread the victory points around.
It is interesting to note that lowest expected cost victories use the synergy between:
- Drawing development cards for the Biggest Army
- Collecting Victory Points development cards along the way
- Using the Road Builders development cards as a way of financing your Longest Road owner title.
Is the cheapest win also the fastest way to win?
All this makes the case for the cheapest expected victories. But as any person who has ever done a budget will know:
Looking at the resources expense is fine. But what about the resources revenue?
Unfortunately, other elements in Catan affect the speed at which victory can be attained… There is not much point in going for the cheapest route if it is not also the fastest, isn’t it?
Next, I will examine how building cities and settlement affect the number of resources cards you receive each turn… And how it affect the relative speed at which you can attain each of the listed victories!
In The 98 ways to win at Catan – Part III
Until then, have fun!
I hope you gained some insight in the probabilities of playing cards in Catan.
Is there something I missed, or that you would like to see added to this article?
Are you planning to cover the additional and situational benefit of the knight card, in that it can remove the robber from your precious resource tiles? How would you measure how this factors in statistically?
For the next part I calculated how we can expect to receive from tiles, so I could use this to make a crude evaluation of the resources penalty a player can expect from the robber. And we could easily evaluate for how many turns can you expect to play before the robber come back.
But it is very game dependent, since how the robber is used against you depends on how in the lead you are (or if you share a resource with a player that is in the lead).
Here it would help to have some data about real games, to see how often a knight card is played to remove a robber from a player tile.
I was not planning to consider it for the moment, but I’ll think about it!
Thanks!
Can you please explain exactly how you calculated the expected cost of victory?
Well, if you consider the specific items needed for a victory. You have item with a fixed cost (for example a road: cost 2 resources). And you have variable costs (a victory point development card). The expected cost take the fixed cost, and add what will cost you, on average, the development card (taking into account the average cost of drawing such a card when you consider the probability of having to draw several cards to get it). Basically, I consider all the possible way of drawing cards until you draw the desired cards, and weight the cost of each of those according of the probability of each, and the reward associated to the undesired but still useful cards)