
The world is ending and the Great Old Ones are awakening for the ultimate battle, the one that will determine the ruler of this new devastated world…
This is the set up of Cthulhu Wars, a beast of a game, in every sense of the word…
For this final epic battle, you are equipped with very large miniatures, as scary as the Great Old Ones should be…

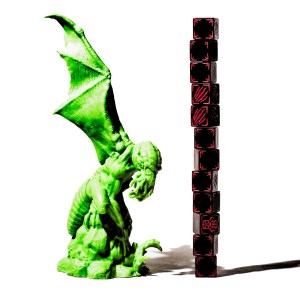
To give some scale, here is Cthulhu with a pile of 12 normal dice:
In this game, each faction plays very differently. In their unit types, intermediate goals and abilities. And while it makes the game a thrill to play, it can also makes strategy analysis quite complicated!
Since it is one of my favorite games, I was looking for a reason to write about it. But I needed to think of a chewable aspect to attack first.
Analyzing the factions individually would have been very interesting, but I had to start somewhere smaller, so I decided to start with… the map!
What to expect in this post
This post is about analyzing the different Cthulhu Wars maps from a graph theory point of view.
My goal is to present an interesting way to think about maps in games, hopefully allowing to gain interesting strategic insights when looking at any board game map!
As a case analysis, I will be analyzing the different maps for the different possible player counts in this game. Maybe the variations between different player count maps will affect the gameplay and the strategy involved!
Beside simply looking at the maps graph, we will be visiting different metrics that concern the strategic importance of locations on a map:
- Connectivity
- Graph diameter (the longest shortest path)
- Closeness centrality
- Betweenness centrality
- How those measures are related, and the value of finding outliers in their relationship.
Since this is about the Cthulhu Wars maps I’ll try to sprinkle some insights about the game along the way. I’m hoping experienced players will be able to use some information to inform their own strategy, but this is not a strategy guide!
I also found something amusing: The Petersen Graph.
I think others may find the analysis interesting in and of itself, and the metrics presented here can be applied to other games, so, their potential usefulness extends well beyond Cthulhu Wars!
So let’s start at the beginning.
What is a graph?
Let’s quickly define what is a graph…
From Wikipedia:
In mathematics, graph theory is the study of graphs, which are mathematical structures used to model pairwise relations between objects. A graph in this context is made up of vertices, nodes, or points which are connected by edges, arcs, or lines.
So, imagine a set of points, linked together by a network of lines, like roads connecting a set of cities!
Since Graphs are one of the prime objects of study of discrete mathematics, there is quite a bit of existing metrics and ways of looking at them that have been developed by an army of dedicated mathematicians. Hopefully we can use this to gain some information in the graphs used in board games!
Cthulhu wars map as a graph…
A map with areas delimited by boundaries or frontiers can be viewed as a graph. Each area can be considered as a node, and the common boundary between two areas as a two-way edge. Seen that way the map is a graph of the places you are allowed to visit.
As in real life, where interactions of all sorts are far more intense when you share a common boundary, the shape of the map and the interconnectivity of emplacements matter quite a bit when it comes to interacting with other players.
Some games explicitly trace the graph for you with the nodes and edges. Pandemic does this.

(Based on a photograph by Padaguan, distributed under a CC BY-SA 4.0 license)
I gave a similar treatment to the Cthulhu Wars map in the title image at the beginning of this post.

In a war game where territories are fought over and then occupied, it feels more satisfying to draw the world map with frontier like boundaries (and it leaves you more space to amass a large army in one location). And having a “real” map is probably part of what make games like Risk attractive (to use a classic example), they give you a very real feeling of conquering the world!
Constructing the graph behind a map can simplify its understanding quite a bit, avoiding some confusion about what connects to what. And since this is a game, only interconnections matters, not the shape of the boundary between them!
But much more importantly, with such a simplified model it is easy to use a computer and apply graph analysis! So let’s use this to gain some insights from the game, based on how you can navigate the map!
Different maps for different player count
In Cthulhu Wars you play on a different map, depending if you are playing with 3, 4 or 5 players.
The map is composed of two double sided boards, one side for 3 players, the other for 5.
When playing with 4 players, you simply use the 3 players side of one board, and the 5 players side of the other.
This has the side effect of giving you two different maps to use with 4 players, not bad!
The size of the maps
The numbers of locations on the different player count maps are the following:
- 3 player map: 13 emplacement
- 4 player map (5-3 variant): 17 emplacements
- 4 player map (3-5 variant): 17 emplacements
- 5 player map: 21 emplacements
Which is simply 4 locations per player, plus one. Since the extra space is disputed among a greater number of players, we can consider that the maps are a bit tighter with a higher player count… But not by much!
For the curious, here are the 4 different maps:
(Augmented by strategically placed Scrabble tiles to make the graph easier to extract).
3 players map

4 player map (5-3 variant)

4 player map (3-5 variant)

5 player map

The constance of water
Beside the locations count, the first thing I noticed was that all the maps have the same ocean divisions.
There are 6 spaces that are considered water, and in Cthulhu wars, there is one faction that is water dependent: Cthulhu!

When you play this faction, and that Cthulhu himself is in play, he has the very interesting ability to ‘submerge‘ himself with a whole army, from any water tile… Subtracting him from any attack while doing so, but more significantly: he can re-emerge anywhere on the map. And since he packs quite a punch, this gives him the ability to deal a powerful attack anywhere, without further notice. Something to make the other players quite nervous for the safety of all of their important locations.
However, since you have to submerge Cthulhu from a water-based location, re-emerging on land can be costly. If you want to do this again, you will need to move him and all other accompanying units back into the water before submerging again… This will cost you one point for every unit you need to move, instead of one point for the bunch when submerging or emerging…
If we look at the fraction of the map that is considered water, we find the following:
- 6 of the 13 emplacements (46.15%) of the map is water when playing with 3 players
- 6 of the 17 emplacements (35.29%) of the map is water for both 4 player maps.
- 6 of the 21 emplacements (28.57%) of the map is water when playing at 5 players!
Cthulhu has a much higher relative mobility with a lower player count!
What about the relative mobility of others?
For all the factions that have to move one or two spaces at a time, the actual connectivity of the map is very important. We can look at it from a different point of view:
The first step here is to consider:
How many frontier does the typical location have with other locations?
Planning for victory, and planning for the retreat
One interesting thing to note here is that, in Cthulhu Wars, battles often do not result in the decimation of one army. Most of the time, several units are simply injured and pushed away from the conflict location.
However, they can only retreat to a location without units from the opposing faction involved in the combat. If they cannot retreat anywhere, they all stay there, but one additional unit has to die.
So before attacking a location with less neighbors, it is far easier to plan ahead and surround them first. Locations with 2 or 3 neighbors are far more vulnerable to this. But more generally, the less neighboring locations, the easiest it is to set your pieces to influence in which direction you want to push your opponent back.
To get a good understanding of this, I decided to build a histogram for the connectivity of each map.
This will tells us how many locations have a specific neighbors count.
Connectivity histogram for the 3 player map:


This histogram tells us that:
- 1 location – Australia – has 2 neighbors
- 2 locations – Europe and Antarctica – have 3 neighbors each
- 2 locations – North America and Africa – have 4 neighbors each
- 2 locations – South America and Arctic Ocean – have 5 neighbors each
- 3 locations – Asia, South Pacific and South Pacific – have 6 neighbors each
- 2 locations – Indian Ocean and North Pacific – have 7 neighbors each
- 1 location – North Atlantic – has 8 neighbors
Location names are not shown in the histogram, so I listed them to help comprehension.
One thing we can notice here, that stays true for all maps, is that water based locations are usually well connected.
The connectivity histogram for the two 4 player maps:


Right away, we can see that the two 4-player maps are quite different, which is good since this at least provide game variability!
The total of connections is almost the same, but there is 2 more for the 3-5 map. There is only one additional frontier on the 3-5 map, but the neighbor connection is counted both ways in the histogram.
One thing to notice is that the 3-5 map histogram has a higher count of location with 4 neighbors (there are 6 of them). And that the neighbor count on the 5-3 map is more evenly distributed. It is hard to extract real meaning from those numbers only, but one hypothesis could be that in the 3-5 maps, there is relatively less locations with extremely low and high connectivity, so those locations could be in higher demand for strategies involving high mobility or less exposure to potential attack from neighbors.
The connectivity histogram for the 5 player map:


Here there is only one location with 2 neighbors (One gold star for you if you guessed Australia!) And while there are still 6 locations with 4 neighbors, the total count is a bit more spread out than before. With a higher average connection count, it means that it will usually be far more complicated to corner someone and cut all possibility of retreat with a higher player count.

Another thing is that with 5 players on the board, there are high chances that the Crawling Chaos faction will be in play. And one of their powerfully annoying and fantastic abilities is to have the final decision on where and how other players’ units have to retreat after a battle… Even if they are not involved in the battle! This can throw a serious wrench in any plans involving a strategic retreat!
(Personally, I find that it adds quite a bit of humor in the end state of each battle)
The longest shortest path in the graph, also known as: The Graph Diameter
One thing I was being curious about is the longest paths in the map. That is, finding the pairs of locations that need the more steps to move between them.
This is interesting, since it may give you a clue as to where to put the elements you want the farthest from each others.
In Cthulhu Wars however, the map is pretty packed, so the longest paths are quite short.
For the 3 player maps the longest paths are of length 3… And there are 8 of them!
- South Pacific to Europe
- Australia to Arctic Ocean
- Arctic Ocean to Antarctica
- Australia to North Atlantic
- Australia to North America
- Australia to Europe
- North America to Antarctica
- Europe to Antarctica
In the 4 player map (5-3) The paths of maximum length take 4 steps:
- Australia to North America East
- New Zealand to North America East
In the 4 player map (3-5) there is one path of maximum length 4:
- Australia to Scandinavia
In the 5 player map, the maximum length path also takes 4 steps:
- Australia to Scandinavia
- Australia to North America East
- New Zealand to North America East
- New Zealand to Scandinavia
So if you were unsure, as in real life, Australia and New Zealand are good places to be… If you want to be far away from everything! (I love Australia and New Zealand by the way).
But this is only part of the picture. Some graph measure can tell us more about how far away places are.
.
How far is everything else. Also known as Closeness centrality
Like a lot of things in graph analysis, this measure is quite simple, but would be annoying to calculate by hand.
For each location, we calculate the shortest path distance to all other locations on the map. This allows us to determine what is the average distance to all other locations, for each location on the map.
This tells you how far away everything is… On average! Or inversely, how central is a particular location on a map !
If you look at the following image, I drew one of the shortest paths for all destinations, starting from North America.

The average distance to other locations from North America is then the sum of the length of all paths, divided by the number of other locations.
(1 + 1 +1 +1 +2 +2 + 2 + 2 + 2 +2 + 3 + 3) / 12 = 22 / 12 = 1.83
So North America is on average 1.83 movement away from any other location on the board (for the 3 player map).
But what about others?
The easiest way to grasp how central is each location, is to represent them on a map!
For this, I color coded each location with their index of centrality.
The more central it is, the redder – And the more remote, the bluer.
Note: I used same color gradient for all the maps. This way we can compare directly one map to another, only by looking at the colors. (I calculated the 4 maps before establishing the lowest and highest values for the color gradient scheme)
The 3 player map:

For the 3 player map, we can see that Australia is the farthest away, followed closely by Europe and Antarctica. So if you want to avoid others, those would be the locations to consider.
At the opposite North Pacific, North Atlantic and the Indian Ocean are closer to the action, with an average distance of 1.42 to every other location.
The 5 player map:

For the 5 player map, We have similar farthest places, with Australia and New Zealand being the farthest, followed by Scandinavia and Antarctica. Of interest is North America East, that ends up being far less central than North America West or Central America!
The 4 player maps:
Interestingly, the 4-player maps are a bit different from each other!


The 5-3 version is a bit more polarized between far away, and well connected places In the 3-5 map, we have North America, Europe, and East Africa, that are colored almost white, which mean they are of average centrality. (In this regard, we could say that the 3-5 map is more similar to the 5 players map, and the 5-3 map is closer in spirit to the 3 player map).
If you compare the closeness centrality for Australia on both maps, it is at an average distance of 2.44 movements on the 5-3 map, but only 2.38 on the 3-5 map. This is mainly because New Zealand, when present, cut its access to the South Pacific ocean!
Being central and the strategic advantage
Being central can be quite interesting for some factions in this game.
For the Crawling Chaos faction, who can often move two spaces instead of one at a time, being central can be very useful! While higher mobility can make being remote less of a hassle, positioning yourself where you have access to mostly everywhere in a single turn can make you quite effective on the map!
.
Being on the critical path, aka: I’m blocking you!
Another very interesting metric we can use from graph theory is about how annoying is a location when it comes to blocking others movements. Or, if you are the sneaky type, how easily avoidable is your location on the map when others want to move.
Betweenness centrality: The number of time a location ends up on the shortest path between two other locations.
Here is a measure of the likelihood you’ll end-up inadvertently on the path of someone else moving on the map. This is highly dependent on individual games, but early on, this can be interesting to know when laying down the seeds of your strategy!
Cthulhu Wars is not necessarily the best example to showcase this metric, since you do not have to fight someone when passing by if you do not want, but since they can decide to attack nonetheless, this is still somehow relevant!
Calculating the Betweenness centrality
Here we consider again the shortest path from every location to every other location. But this time we count how many times a location ends up on the critical path of others.
One important thing to note here is: What to do when there is two or several possible paths of equivalent length between two locations?
The answer is simple, we consider all the shortest paths, and count the fraction of those that pass through the location we are evaluating.
If a location is on the only shortest path between two others, it will count as 1. If a location is on half the possible shortest paths between two nodes, it will count as 1/2.
If you look at two simple examples

For the path between A and C:
- In fig 1: we would count 1.0 to the betweenness score to node B.
- In fig 2: we would count 0.5 to node B and 0.5 to node D.
This is not always intuitive. So just to be sure, let’s look at the final results for the 2 previously simple graphs, we would have final betweenness scores of:
Fig 1:
- A is 0
- B is 1
- C is 0
Simply because path of length one (A-B and B-C here) do not contribute to betweenness scores, having nothing in-between.
Fig 2:
- A is 0.5
- B is 0.5
- C is 0.5
- D is 0.5
The second graph is in fact a circle, and if we take each unique pair of length greater than 1, well there is only two of them A-C and B-D.
Each one having two possible paths…
Let’s now have a look at the color coded maps for betweenness centrality:
Color coded maps for betweenness centrality
The 3 player map:

As you’ll see with all the Betweenness centrality maps, water based locations are quite in the way of every possible long range movement. The only consolation for our poor Cthulhu, is that his home base is in the South Pacific ocean, which is of average betweenness, far less than other oceans…
Asia seems to be the most travelled land base location on the 3 player map (And incidentally, the Crawling Chaos home base).
The 4 players maps:


Here I used a common scale for both 4 player maps. We can see this by the lighter shades of red used on the 3-5 map, since the highest value on the 5-3 map is a bit higher. So even with the same amount of locations, the distribution of betweenness values varies according to the graph.
Compared to the 3 player map, we can see that North Atlantic, Indian Ocean and South Atlantic keep their strategic positioning, and that when fragmented, Arabia takes the betweenness that belonged to Asia in the 3 player map. (A good thing for the Crawling Chaos since its home base is in South Asia for the fragmented map).
Other fragmented locations, which only happens to land based locations, seems to preserve their off-the-beaten-path remoteness of their non fragmented versions, as indicated by the deep blue of North America, South America, Africa, Europe and Australia, both in their monolithic and sliced version.
The 5 player map for betweenness centrality:

Here we can see that a lot of locations are really not on the obligatory path between other locations. But a few of them are really on the path of everything. So depending on how a troublemaker you want to be, North Atlantic, Indian Ocean and North Pacific are important places to hold if you want to have a say on others movements in the game.
Comparing the 5 player map to other maps highlight one problem with using the raw number of times a location is between two others:
The more locations there is to evaluate, the higher the numbers for betweenness are.
One solution is to normalize the numbers in order to get a more uniform measure (for betweenness in an undirected graph people usually divide by (n-1)*(n-2)/2 where n is the number of nodes), but even that comes with its own limitations. So I simply opted here to use different color scheme for the 3 and 5 player maps.
.
How closeness centrality differs from betweenness centrality
Closeness centrality: How close to everything is a location.
Betweenness centrality: How often a location is on the shortest path between two other locations.
The two are closely related, but they are not the same thing!
I think we can use the combination of the two metrics to identify uniquely interesting locations on a map.
When it comes to warfare, the terrain advantage is not to be neglected!
Admittedly, Cthulhu Wars is not necessarily the best example to showcase the relevance of this. But if you think about war games in general, I think it makes for an interesting strategy analysis! If you want to select a starting position with a defensive or offensive advantage, this can be used to evaluate the positions before the game settle with its own warfare logic.
To be fair, I did not know where analyzing any game map as a graph would led me… So here we are!
Let’s have a second look at the previous Betweenness and Closeness and centrality maps, but side to side for each measure.

First we can see that the coloring for the betweenness (maps on the left) is very consistent for all player counts.
As we can expect, the closeness centrality slowly shift toward the blue with higher player count, since the more locations on the map, the longer the average road between any two locations.
But if we compare the pair of maps for each player count we can identify interesting patterns:
- Australia is both Remote, and off the beaten path.
- North Atlantic is both close to everything, and on the path to everything.
But what about in between cases?
Can we find something central, but not in the path of other things?
Is there locations far from everything, but in the way of most movements?
To get a better grasp on how those things relate, and make detecting outliers easier, I decided to graph the values differently, on a bubble chart.
It’s my first attempt at this type of graph and I’m not yet fully satisfied at the results ( =some of the locations ends up hidden), but I think there is something interesting here.
Centralness vs Betweenness for the 3 player map
Here is the graph for the 3 player map, with:
- Centrality on horizontal axis (Central locations are on the left)
- Betweenness on Vertical axis (The higher, the more in-between)
- Size of the bubble for connectivity (Proportional to the number of neighbors)

As the graph shows, there is a clear relationship between centralness and betweenness values, they all seems to follow a similar curve.
But the curve is not completely smooth, and sometimes we can spot an outlier. Here, South Pacific stands out since it is as central as South America, but score higher on the betweenness side.
And even when following a smooth curve, the whole bottom of the graph has almost no betweenness while spanning a large part of the possible centralness values. Varying between 1.7 for Africa, to 2.1 for Australia.
So even when the curve is smooth, I think this graph is interesting to look at.
Centralness vs Betweenness for the 5 player map

On the 5 player map, we can divide the locations in different groups, easily identifiables.
- Clearly the top left is the ocean locations with High betweenness and a low centralness value (So close to everything).
- You have a middle group of average centrality and low betweenness. Located at an average distance of about 2.0 movements from everyt other locations.
- And the bottom right is occupied by very low betweenness and high value of centralness (far from everything). This group include: Antartica, Scandinavia, North America East, New Zealand and Australia.
Some other observations:
- South Atlantic and Arabia seems to be in-between two groups.
- Arabia is the leftmost land based location. (Closer on average to everything)
- Arctic ocean is the rightmost ocean based location. (Farther on average to everything)
Centralness vs Betweenness for the 4 player maps
5-3 map


For the 4 player maps, the 5-3 map looks like the curve drop is steeper. We can see that Africa is very low on the betweenness for its centrality, which could make this location interesting if we want to be close to everything, but not on the most frequented path.
But I find it hard to make grand generalization only from those bubble graphs.
I think the most interesting thing is to compare map neighbors that are far away on the graph.If you look at the 3-5 map, East Africa and Arabia are neighbors on the map… but not on the bubble chart!
- Arabia, almost in the top-left, is close to everything, and score high on the betweenness scale.
- East Africa, in the bottom middle, is farther from everything and almost never on the critical path of anything.
In a war game, this kind of chart could be useful when choosing between two locations during a game. It could help to evaluate the strategical value of both positions before choosing.
Some thought on the centralness vs betweenness graph
When I first consider this graph, I was kind of hoping to find 4 types of locations, based on the different matches of those two values.
- Central but not in the way of others movement
- Central and in the way of others movement
- Remote and not in the way
- Remote and in the way of others
However, it seems that we can find 3 of those, but no location are remote and in the way. Which would be on the top right corner of the bubble graph.
Maybe we could find graphs where such location exists, but it would require a special effort from the map designer. I have no idea what this could look like as a map. Maybe I’ll investigate this at some point, trying to generate graphs with the worst outliers!
Something to think about!
The strange and occult coincidences one encounters

Let me remind you that the name of the designer of Cthulhu wars is Sandy Petersen!
(Just to be clear, the graph is attributed to Julius Petersen a Danish mathematician).
An apt description of this graph is given by the well known computer scientist Donald Knuth: “a remarkable configuration that serves as a counterexample to many optimistic predictions about what might be true for graphs in general.”
It has kind of esoteric properties such as being the smallest bridgeless cubic graph with no Hamiltonian cycle.
Ok, I’m stretching things a bit here, but the easiest way to sums it is that it is a small graph that can be used to test edge cases of a lot of graph theorems, so it is very useful! You can have a look at the wikipedia page, but It is kind of hard to read for non-graph people
What makes it interesting is that it most frequently drawn as a Pentagram. A figure which has been used by some modern occultists as a satanic symbol. A perfect fit for a game full of daemons!
So there you go: The Petersen graph is all about putting a bit of chaos in graph theory.
I’m sure Cthulhu himself would be amused.
Final words
It was quite fun to take a more mathematical approach at looking at a game map.
And while I was tempted to approach other games as comparison points, this post being already way too long, it would have widened the scope of the discussion in an inadmissible way.
However, now that I have the tools and some insights, I intend to come back to this topic. I think it will be easier to gain strategic insights for a map if we can compare different choices that were made by different game designers for their map topology.
I’m already thinking that Risk, Pandemic, Powergrid and Cthulhu Wars should make for a nice overview. If you have other games you think would be even more appropriate, don’t hesitate to suggest them to me!
Do you know of any other interesting graph theory metrics that we could apply to board game maps?
What game would you like to see get a similar treatment?
Nice one. Thanks for sharing.
“can simplify it’s understanding” -> “can simplify its understanding”
“since it’s home base” -> “since its home base”
“with it’s own warfare logic” -> “with its own warfare logic”
“the betweenness for it’s centrality” -> “the betweenness for its centrality”
Great analysis!
Some numbers for the 8 player map
30 total spaces
Connections:
2 min Australia,
11 Max North Atlantic,
Average 5.67,
7.44 average for the 9 ocean spaces.
Closeness Centrally:
1.667 Min North Atlantic and North Pacific,
Max 2.667 Australia,
1.937 Average of all Ocean spaces.
Thanks for the information! It’s great that you took time to calculate the connectiveness and closeness centrality for it, and specifically for ocean spaces!
So I see here 30% of spaces being water. So it does not changes the balance too much for Cthulhu Submerge ability.
I thought about doing a similar analysis for the 8 players-map, but I’m working on another series of article for the sake of variety. I’m glad that you found it interesting enough to calculate it yourself, that’s great! I should share my code at some point so that other can use it, but I never really done that before, there would be some clean up to do first!
Hopefully I will have a new article soon, but thank you for your contribution, it’s greatly appreciated!